Oncall isn't supposed to be this hard
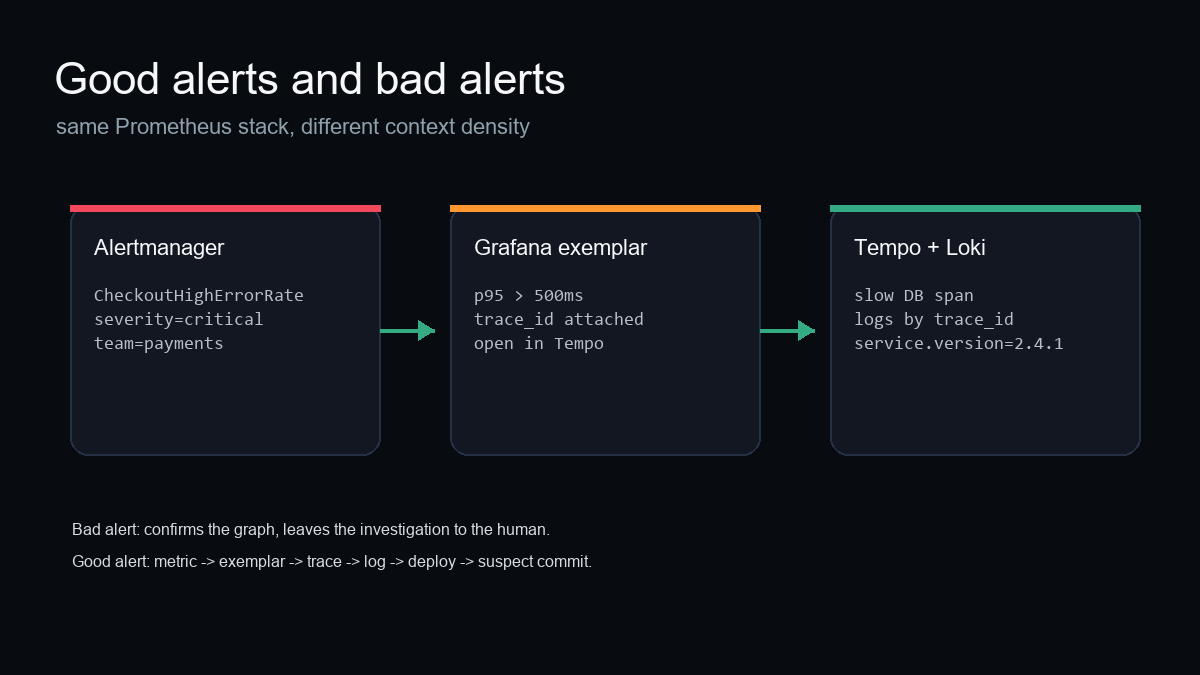
Well-configured alerts connect the symptom to traces, logs, deploys, and the suspect commit.

Bad Prometheus alerts tell an oncall engineer something is wrong, while good alerts connect the symptom to traces, logs, deploys, and the suspect commit.
That distinction sounds small until you're on-call and an alert storm appears.
You open one of the alerts and see:
[CRITICAL] CheckoutHighErrorRate - 7.3% 5xx in prod-eu-west-1
The alert is not wrong. Checkout is error'ing out. But it hasn't told you why or even which host/container/VM to start investigating from.
let the wild hunt begin
The SRE / Developer now has all the work to do.
If you know what you're doing, you first check the alert definition.
A basic Prometheus setup usually looks like this:
- alert: CheckoutHighErrorRate
  expr: |
    sum(rate(http_requests_total{service="checkout",status=~"5.."}[5m]))
    /
    sum(rate(http_requests_total{service="checkout"}[5m])) > 0.05
  for: 10m
  labels:
    severity: critical
    team: payments
    service: checkout
  annotations:
    summary: "Checkout 5xx rate is above 5%"
    runbook_url: "https://runbooks.corp/payments/checkout-5xx"
    dashboard_url: "https://grafana.corp/d/checkout"
This gives you some important pieces of information:
- The alert aggregates HTTP errors (including timeouts) over a 5 minute period and compares it to a threshold.
- The alert is owned by the Payments team.
- There is a playbook you can start from.

But there is no reason to celebrate just yet.
The real work begins now.
Adjust the time window to within 5 minutes of the alert time.
- Open Grafana and check if the dashboards have any extra information.
- Open Loki and write a query like `{service_name="checkout"} |~ "(?i)error"
- Open Tempo and filter traces by time. Guess which trace represents the incident.
- Open your CD pipeline and search for any deploys just before the alert.
At some point, several possible hypothesis appear.
Big newly introduced feature in the checkout-api@v2.4.1 looks fishy.
High CPU usage on 3 out of 5 hosts that reported 5xx errors.
Suspicious I/O errors on all the investigated hosts.
Slow DB transactions.
Eventually the developer manages to reconstruct context across four tools, in about an hour if they know exactly what they're doing.
Meanwhile, there may be other fresh alerts to investigate.
good alerts tell you where to start looking
The same stack can behave very differently.
Not a different vendor. Not a more expensive alerting product.
The same stack, wired correctly to bubble up context.
Here is what it would look like for the Prometheus/Grafana/Tempo/Loki stack:
  -> Prometheus exporter using OpenTelemetry SDK.
  -> histograms correlated with trace spans.
  -> Grafana exemplars enabled.
  -> Tempo setup with trace-to-logs enabled.
  -> deploy marker / service.version / commit SHA added as metadata with each alert.
The alert still starts with a metric. It should. Metrics are how you detect the symptom.
But the metric now carries a breadcrumb to a specific request.

Prometheus alerts do not naturally carry a trace_id. A histogram bucket is an aggregate, not a single request.
Exemplars change that. A sampled measurement can attach the active trace_id to the bucket. Grafana can render that as a clickable diamond on its graph. Click it and Tempo opens the representative trace.

In the good version, the selected span says:
service: db-primary
operation: SELECT orders WHERE user_id=$1
duration: 1210ms
db.rows_affected: 1110482
feature_flag.new_checkout: true
service.version: 2.4.1
We see the slow database queries in the distributed trace .
Then Tempo's trace-to-logs link opens Loki for the exact trace.

The log line is not buried in a time-window query anymore:
slow query: seq scan on orders (1.1M rows), index not used
trace_id=4bf92f3577b34da6a3ce929d0e0e4736
span_id=00f067aa0ba902b7
service.version=2.4.1
commit=7a3f9c2
Now the hypothesis is no longer vague.
checkout-api@v2.4.1 added the new order-history query path.
The user-id column needs to be added as an index.
The bad path is gated by feature_flag.new_checkout=true.
Disable the flag or roll back 7a3f9c2.
the configuration is what makes the oncall experience fun
None of this is automatic and doesn't come automatically, whether you are using Prometheus + Grafana, Datadog, or New Relic.
The good path needs deliberate plumbing:
- Page on symptoms: error rate, latency, traffic, saturation, or SLO burn.
- Put
team,service,severity,runbook_url, and a scopeddashboard_urlon the alert. - Propagate W3C trace context through every service.
- Inject
trace_idandspan_idinto structured logs. - Enable exemplars on the histogram used by the alert.
- Configure Grafana so exemplars open Tempo.
- Configure Tempo trace-to-logs so spans open Loki.
- Emit
service.version, deploy annotations, and commit SHA from CI/CD.
You can play around with such a well-configured setup here.
AI SRE
The useful AI SRE workflow starts after the observability stack has preserved the evidence trail. The agent can help with root cause analysis, propose the fix, and validate the patch. But if the alert drops the trace, the log correlation, and the deploy context, the agent has the same problem the human does: it is guessing.
For where we are taking this in the product, see FixBugs and AI SRE tools.